If you track your game on the greens, you probably keep track of “number of putts per round”, or “number of three putts”. These classic stats may give you a bit of an idea about your putting, but they’re really too imprecise to be useful, often verging on misleading.
Let’s talk about strokes gained putting, how it works, how to track and maintain it, and how it will give you a clear picture of your game on the greens.
What’s Wrong With Traditional Putting Stats?
Before we dive into strokes gained, let’s quickly explain why “putts per round” isn’t a good stat. Let’s compare two players:
- Player A is a great ball striker. He hits an average of 14 out of 18 greens in regulation. He averages 33 putts per round.
- Player B struggles with his irons. He hits an average of 6 greens per round. He averages 29 putts per round.
Who is the better putter? It’s not so clear. Player B has fewer putts, but because he chips onto many greens, he’s probably starting much closer to the hole.
Strokes gained clears up this ambiguity, letting each of these players see his putting performance separate from other facets of his game. It also lets him separately analyze his putting ability from all ranges, be it short putts, medium-range, or lag putts.
What is Strokes Gained Putting?
Strokes gained putting compares your putting to a baseline player. With the Pinpoint Strokes Gained App, you can choose any baseline from an average tour pro to an average 20-handicapper.
Rather than simply tracking the number of putts, you track the distance of each putt. By looking at the distance of each putt, you can compare the outcome of the putt to the average outcome by your baseline player.
For example:
- Let’s say your baseline player is an average 5-handicapper.
- Now let’s say you’re facing a 25-foot putt. How will different outcomes affect your strokes gained putting?
- From 25 feet, the average 5-handicapper takes 2.05 strokes to hole out. (You can think of this as meaning they almost always two-putt, but they three-putt slightly more than they one-putt. So the average is a little greater than 2.)
- If you hammer your putt 5 feet past the hole, that’s not a good putt by any measure. From 5 feet, the average 5-handicapper takes 1.36 strokes to hole out. By going from a position of 2.05 to a position of 1.36, your strokes gained is -0.31. Negative strokes gained indicates a bad putt.
- If you sink your 25 footer, you went from a position of 2.05 to a position of 0 (in the hole). So your strokes gained is +1.05. Positives strokes gained indicates a good putt.
When you add up all those strokes, you can measure your putting overall, how you did on long putts, how you did on short putts, and more.
How To Understand Strokes Gained Putting
One of the best things about strokes gained putting is the depth of information that you will get. For the first time, you will have the data and stats necessary to be able to change your putting game.
With the Pinpoint Strokes Gained App, the strokes gained putting data is broken down into several categories.
Here is how you can understand some of that data.
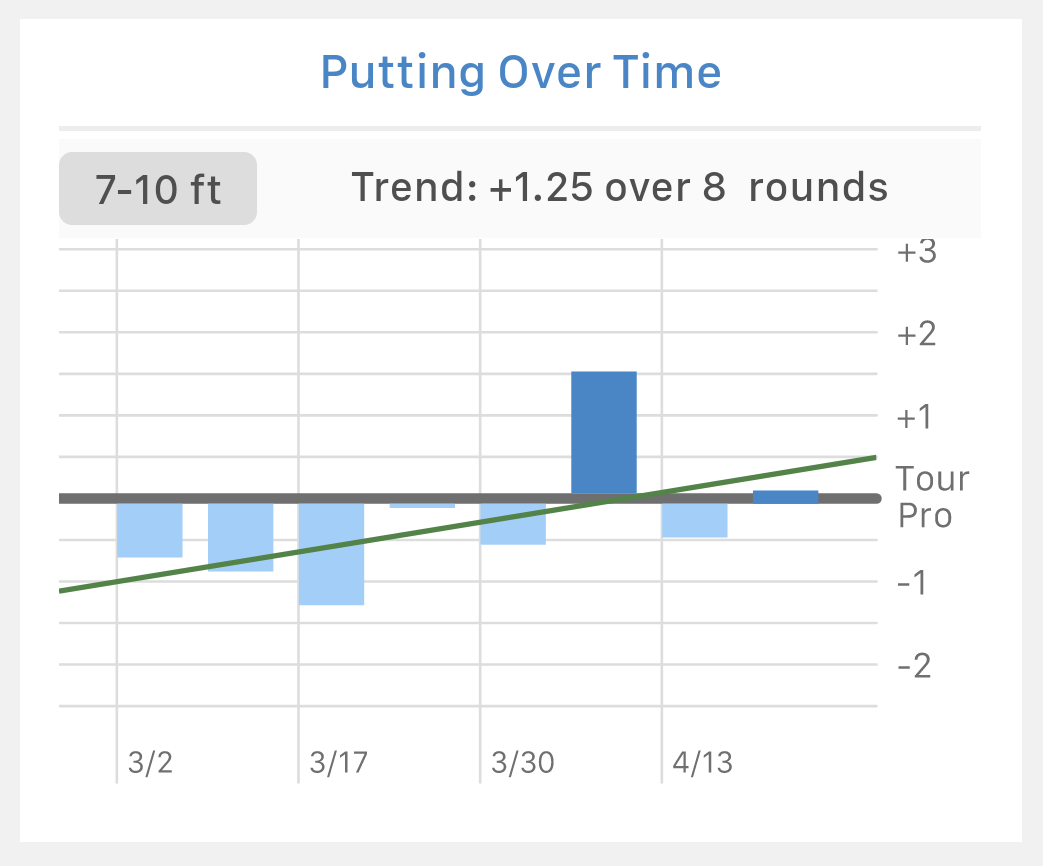
Putting Over Time
How has your putting strokes gained changed over time? Are you trending up or down? Maybe you see you’ve been stuck at -2 strokes gained per round for several weeks, or even lost a few strokes. It might be time to hit the practice green or take a lesson.
The great thing about the putting over time stat is it helps you analyze if the changes you are making to your game are actually working.
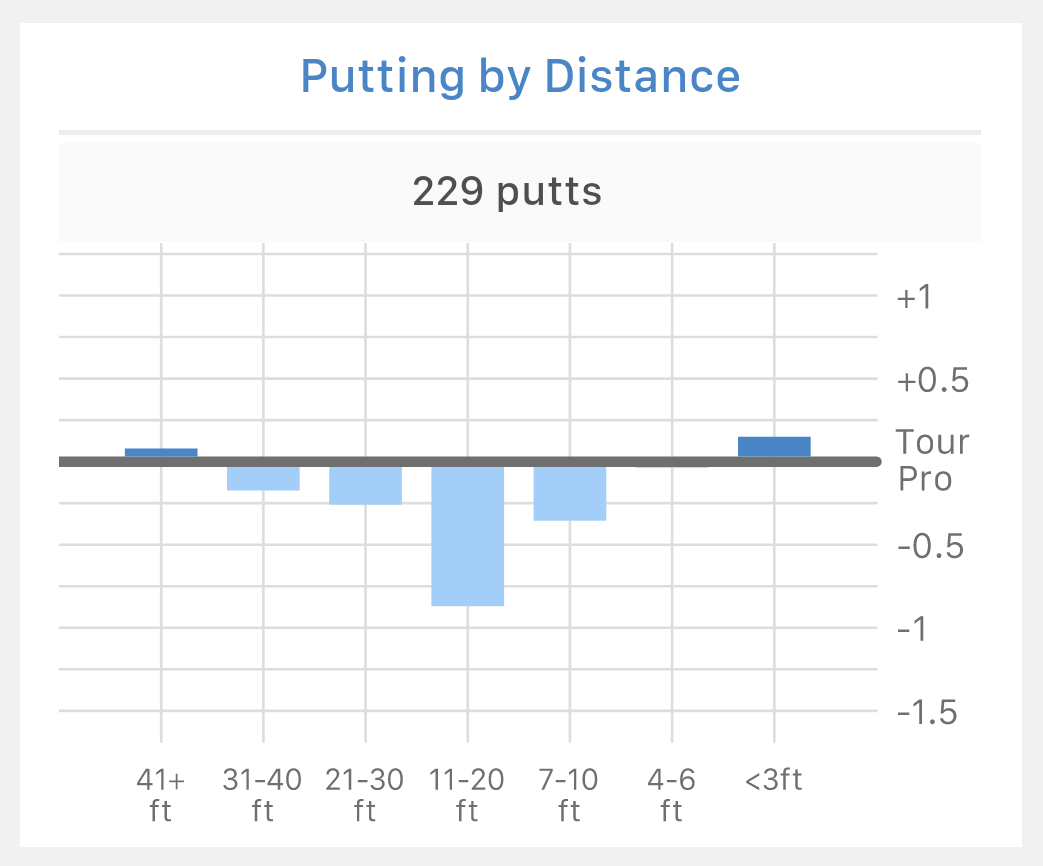
Putting by Distance
Where do you thrive on the putting green? Where are you weakest?
You may find that you are gaining two strokes from 15-30 feet but losing two strokes from 3-6 feet. By working on your short putts, you can quickly shave strokes off your score.
Putting Distribution
How consistent is your putting? Are most of your putts average? Do you make more great putts than terrible putts? Pinpoint shows you the distribution of putts that add up to your totals. Very consistent putters will have a green distribution graph, indicating very few poor putts.
What Other Putting Stats Are Helpful?
Strokes gained is the best way to look at your putting from any distance, but tracking your putts by distance also gives you some other useful information.
Two Putts or Better by Distance
Let’s face it: 3 putting is a major problem. When you three putt, you are throwing strokes away and making bogeys even after hitting greens in regulation. The best way to avoid a three putt is to be confident in your lag putting.
Most golfers have a distance from the hole where they start to struggle with two putting. For better players, this can be 40 feet or more. For beginners, it could be 20 feet or less.
This is a perfect piece of data to use to work on your putting game. Instead of walking up to a green and trying to make 10-footers, find the distance where you start to struggle with three-putting. Practice putting into a 3-foot circle from that distance and beyond, so you can be confident in two-putting every time.
One Putts or Better by Distance
This is one of the best stats for the lower-handicap players. Aside from looking at strokes gained from twenty feet and in, you can also look at where you’re making one-putts.
If you’re a strong player hitting lots of greens in regulation, make sure you can one-putt as often as the pros, so you’re making birdie at every opportunity. Take a look at the table below and see how it compares to your own numbers.
| Distance | PGA Tour One-Putt Percentage |
|---|---|
| 2 Feet | 99% |
| 3 Feet | 96% |
| 4 Feet | 88% |
| 5 Feet | 77% |
| 6 Feet | 66% |
| 7 Feet | 58% |
| 8 Feet | 50% |
| 9 Feet | 45% |
| 10 Feet | 40% |
| 15 Feet | 23% |
| 20 Feet | 15% |
One helpful drill is to set up 10 putts at each distance and make more of them than the PGA tour percentage. For example, set up 10 putts in a circle around the hole from 10 feet. Sink at least 5 out of 10 before moving on to the next drill.
Using Your Strokes Gained Data To Shoot Lower Scores
When you are ready to improve your own game, putting is one of the first places to look. If your overall strokes gained is negative, you have a lot to work on. But even if you’re a great putter, look at your own strokes gained by distance. By fixing the weaker distances, you can shave many strokes off your overall scores.
Here are a few tips that will help you improve your scores:
- Look at what distance you have the lowest strokes gained putting. If your trouble distance is short, practice making putts from that distance. If your trouble is lag putts, practice hitting into a three-foot circle. Using a golf training aid with a tape measure can help you really dial in on these types of putts.
- Compare your one-putt percentages to the table above with the PGA Tour numbers. Set up 10 balls around the hole at each distance and practice making more of your putts from that distance than the pros.
- Find out where you are strongest in your putting distance and where you know you can make two putts from. Use this information when choosing clubs to hit into the green.
- Use Pinpoint to track your strokes gained putting over time. Use this information as you practice to make sure each of your target distances is improving over time.
- Even moreso, use your strokes gained over time to make sure that grip changes, putter changes, or stroke changes actually work to your advantage.
Final Thoughts
Golf is becoming more technology-driven. Even if you’re more of a traditionalist, we recommend taking a look at strokes gained putting. This simple stat can give you so much information about your putting, you can make tremendous progress with minimal time commitment.
Use the Pinpoint Strokes Gained App to analyze your golf game like never before. You can attribute your lower handicap to knowing yourself as a player and truly practicing with purpose.